Understanding Data
Introduction
Data plays an essential role in understanding the world, making decisions, conducting research, and solving problems. In the digital world, data has become a fundamental resource, supporting communication, business operations, scientific research, public services, and everyday activities. The widespread use of digital devices, online platforms, and connected systems generates and processes vast amounts of data.
Data can represent facts, figures, measurements, observations, descriptions, images, sounds, and other forms of recorded content. It is generated and collected through activities such as observations, measurements, transactions, experiments, surveys, and digital interactions. Data can be organized into meaningful structures, processed to identify patterns, and interpreted to support decision-making.
Understanding data begins with knowing what data represents, how it is classified, how it is collected and represented, and how its quality affects the conclusions drawn from it. These fundamentals help explain how raw data can be transformed into meaningful information and useful knowledge, enabling individuals and organizations to understand situations, identify patterns, and make informed decisions in an increasingly digital world.
Fundamentals of Data
Definition of Data
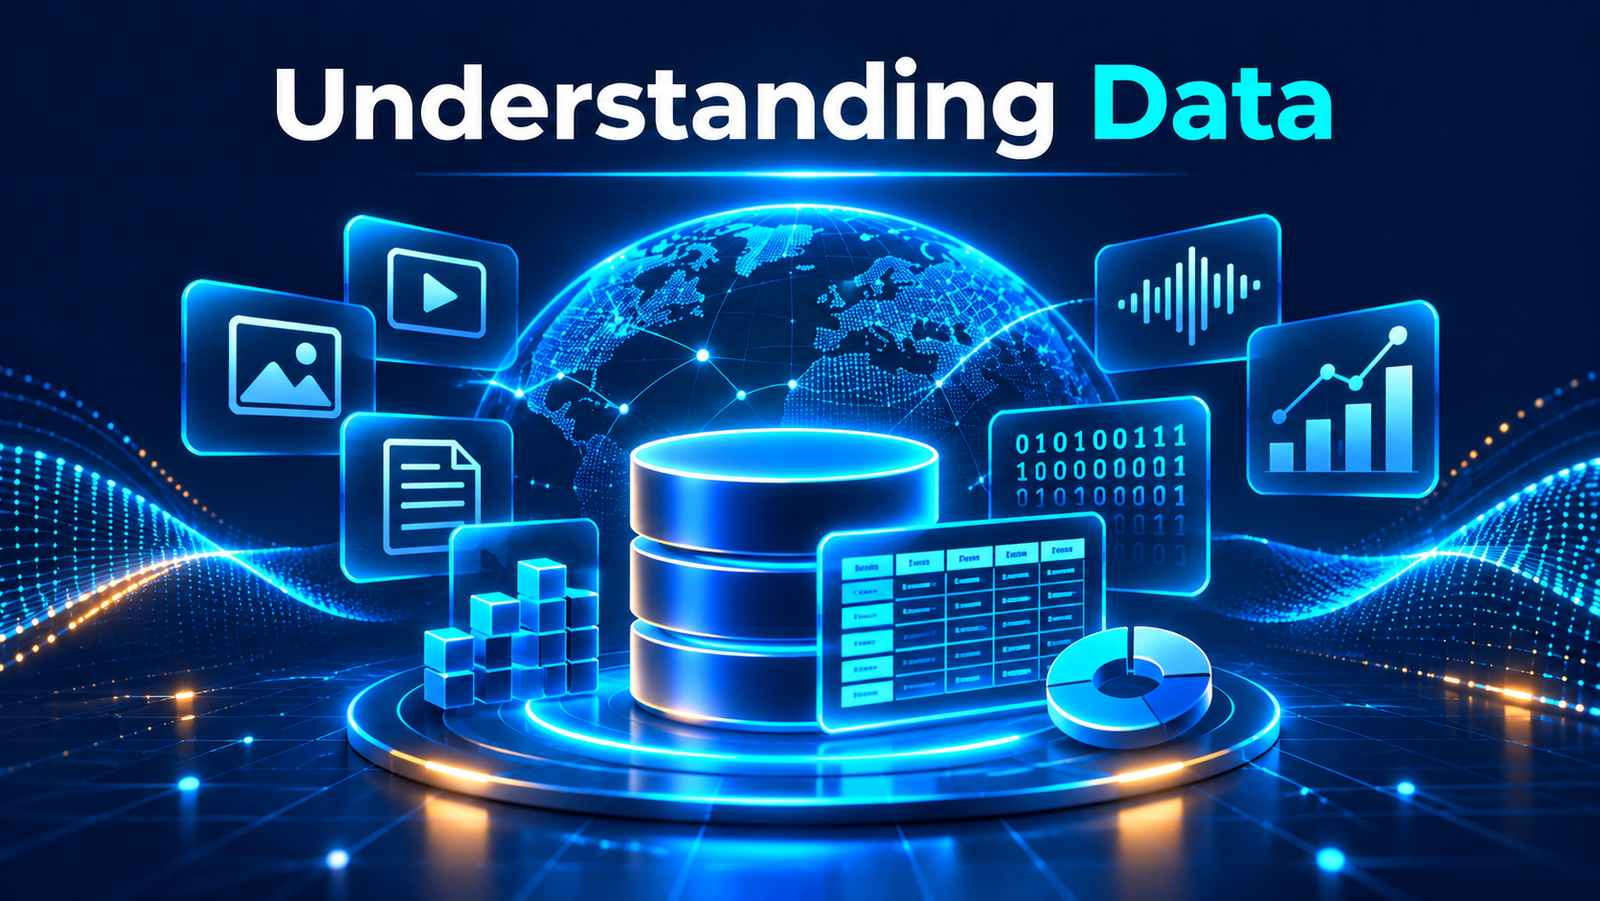
Data refers to recorded facts, observations, measurements, descriptions, or other representations of objects, events, activities, and conditions. It can exist in different forms, including numbers, text, symbols, images, audio, and video.
Data may represent individual observations or collections of related values. Its meaning depends on the context in which it is collected, organized, and interpreted.
For example, the number 28 is a data value. When associated with a person’s age in years, it represents a specific attribute. Additional context helps determine what the value means and how it can be used.
Characteristics of Data
Data has several characteristics that influence how it is collected, stored, processed, and interpreted.
Accuracy
Accuracy indicates how closely a data value represents the actual value or condition it is intended to describe.
Completeness
Completeness refers to whether the required data is available. Missing values may limit the usefulness of an analysis.
Consistency
Consistency means that data does not contain conflicting values or representations across records, systems, or sources.
Relevance
Relevance indicates whether the data is appropriate for the purpose for which it is being used.
Timeliness
Timeliness refers to whether data is available when needed and sufficiently up to date for its intended use.
Validity
Validity indicates whether data conforms to defined rules, formats, ranges, or other requirements.
Importance of Data
Data supports understanding, analysis, planning, and decision-making across many areas of life and work.
Its importance includes:
- Supporting informed decisions through evidence and observations.
- Identifying patterns, trends, and relationships.
- Measuring performance and progress.
- Supporting scientific research and experimentation.
- Improving planning and resource allocation.
- Helping identify problems and evaluate potential solutions.
- Supporting automation, statistical analysis, and artificial intelligence.
The value of data depends not only on its availability but also on its quality, relevance, and interpretation.
Examples of Data
Data can represent different types of facts, measurements, observations, and recorded content.
| Data Category | Example |
|---|---|
| Numeric | 250 |
| Text | Customer Name |
| Date | July 4, 1776 |
| Measurement | 25.6 °C |
| Boolean | TRUE |
| Observation | Heavy rainfall |
| Image | A photograph of a building |
| Audio | A recorded conversation |
| Video | A recording of a public event |
Types of Data
Data can be classified in several ways, depending on its characteristics, source, purpose, and method of collection.
Qualitative Data
Qualitative data describes qualities, characteristics, attributes, or categories rather than expressing quantities through numerical measurements.
Examples include product categories, customer feedback, colors, and descriptions of observed conditions.
Qualitative data is useful for understanding experiences, opinions, classifications, and descriptive characteristics.
Quantitative Data
Quantitative data represents quantities or measurements that can be expressed numerically.
Examples include age, temperature, distance, revenue, and the number of items sold.
Quantitative data can be analyzed using mathematical and statistical techniques to identify patterns, compare values, and measure differences.
Primary Data
Primary data is collected directly from original sources for a particular purpose or investigation.
Common collection methods include surveys, interviews, experiments, observations, and measurements.
For example, an organization conducting a customer satisfaction survey collects primary data from its respondents.
Secondary Data
Secondary data is data that was previously collected by another person or organization, or collected for a different purpose, and is subsequently reused.
Sources include published research, government statistics, historical records, reports, and existing organizational datasets.
Secondary data can reduce the time and effort required to conduct research, provided that the data is relevant, reliable, and suitable for the intended purpose.
Data Structure and Organization
Data can be classified according to how it is organized and how its elements relate to one another. Three common categories are structured, semi-structured, and unstructured data.
Structured Data
Structured data follows a predefined organization, typically using fields, records, rows, and columns.
Each field has a defined meaning and may have an associated data type. This organization makes structured data suitable for relational databases and queries using Structured Query Language (SQL).
Examples include customer records, employee tables, inventory records, and financial transactions.
Semi-Structured Data
Semi-structured data does not follow a rigid tabular structure but contains organizational elements such as keys, tags, attributes, or metadata.
These elements help identify and organize individual values while allowing flexibility in how records are represented.
Common examples include JSON documents, XML documents, and certain types of log records.
Unstructured Data
Unstructured data does not follow a predefined tabular structure. Its content may include text, images, audio, video, documents, and other complex formats.
Examples include photographs, recorded meetings, scanned documents, videos, and free-form text.
Although unstructured data does not follow a fixed tabular structure, it can still contain valuable information that can be extracted through appropriate processing and analysis.
Why Data Structures Matter
Understanding data structures helps determine how data can be stored, searched, processed, and analyzed.
Structured data is organized into predefined fields and tables, making it suitable for relational databases and SQL queries. Semi-structured data uses flexible organizational elements, such as keys and tags, while unstructured data does not follow a predefined tabular structure.
Different storage systems and processing techniques can be used to work with these data types. Relational databases are commonly used for structured data, while document databases can store semi-structured data. Search technologies, machine learning, and artificial intelligence can help extract useful information from large collections of unstructured data.
The appropriate approach depends on the data’s structure, volume, intended use, performance requirements, and processing needs. Unstructured data does not necessarily require artificial intelligence or specialized databases; conventional search and processing techniques may also be suitable.
Data Formats and Representation
Data representation describes how individual values and collections of data are expressed, encoded, or stored.
Text Data
Text data consists of characters, words, sentences, and other textual content.
Examples include names, addresses, descriptions, messages, and written documents.
Text may be represented using character encoding standards such as Unicode, which supports characters from many writing systems.
Numeric Data
Numeric data represents numbers used for counting, measurement, calculation, or comparison.
Common categories include integers and floating-point numbers.
Examples include:
| Numeric Type | Example |
|---|---|
| Integer | 125 |
| Negative Integer | -25 |
| Decimal Value | 18.75 |
| Percentage | 85% |
Numeric representation must be appropriate for the intended calculation. For example, monetary values may require fixed-precision decimal representations to avoid unwanted rounding errors.
Date and Time Data
Date and time data represents calendar dates, times of day, or specific moments.
Examples include a birth date, a meeting time, a transaction timestamp, and the recorded time of an observation.
A standardized representation such as YYYY-MM-DD can help maintain consistency when storing and exchanging dates.
For example, 1776-07-04 represents July 4, 1776.
Time-related data may also require information about time zones and UTC offsets to identify the intended moment accurately.
Boolean Data
Boolean data represents one of two logical values: TRUE or FALSE.
It is commonly used to represent conditions, decisions, and states.
Examples include whether an account is active, whether a document has been approved, or whether a condition has been satisfied.
In practical applications, a Boolean field may also need to represent a value that is unknown, unavailable, or not yet recorded. Some programming languages and database systems support nullable Boolean values, allowing a field to contain TRUE, FALSE, or NULL.
Here, NULL represents a missing or unknown value rather than a third Boolean truth value. Its interpretation depends on the application and the rules governing the data.
| Boolean Value | Example Interpretation |
|---|---|
TRUE | The account has been verified |
FALSE | The account has not been verified |
NULL | The verification status is unknown or has not been recorded |
The distinction matters because FALSE and NULL do not mean the same thing. An account that has not been verified is not necessarily an account whose verification status is unknown.
Database systems may also handle comparisons and logical operations involving NULL differently from operations involving ordinary Boolean values. For example, in SQL, a comparison with NULL generally produces an unknown result rather than TRUE or FALSE.
Binary Data
Binary data is represented using combinations of zeros and ones, the fundamental units of digital representation.
Digital systems use binary representations to store and process numbers, text, instructions, images, audio, video, and other forms of content.
Examples include executable files, encoded documents, and the underlying digital representation of multimedia content.
Multimedia Data
Multimedia data includes images, audio, and video.
Image Data
Image data represents visual content, including photographs, diagrams, illustrations, and scanned documents. Common image formats include JPEG, PNG, and GIF.
Audio Data
Audio data represents sound, including speech, music, and environmental recordings. Common formats include WAV, MP3, and AAC.
Video Data
Video data represents moving visual content, often combined with audio. Common formats include MP4, WebM, and MOV.
The format selected affects factors such as file size, quality, compatibility, and processing requirements.
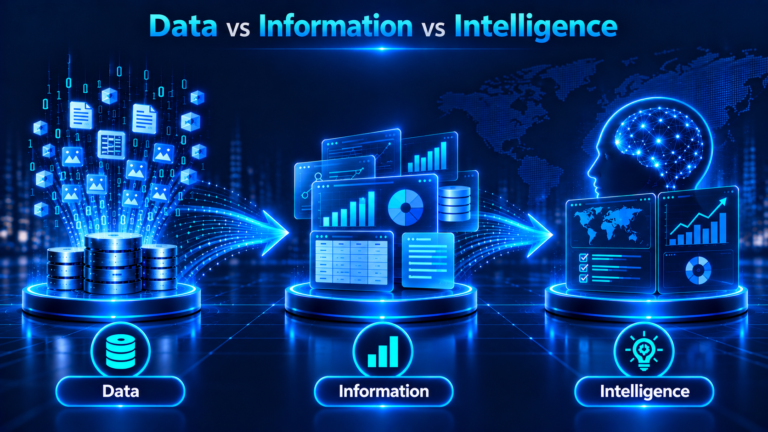
Data vs Information
Data and information are related concepts, but they serve different purposes.
Definition of Information
Information is data that has been processed, organized, interpreted, or presented in a context that makes it meaningful to its recipient.
Information helps people understand a situation, answer questions, and make decisions.
Differences Between Data and Information
| Aspect | Data | Information |
|---|---|---|
| Meaning | Recorded facts, values, or observations | Data interpreted within a meaningful context |
| Context | May lack sufficient context | Presented with context |
| Processing | May be unprocessed or partially processed | Has been organized or interpreted for a purpose |
| Purpose | Serves as an input for analysis and processing | Supports understanding and decision-making |
| Example | Daily sales values | A report showing total sales and sales trends |
How Data Becomes Information
Data can be transformed into information through several activities:
- Collection: Gathering relevant data from appropriate sources.
- Validation: Checking whether the data meets defined requirements.
- Organization: Arranging the data into a useful structure.
- Processing: Performing calculations, transformations, or other operations.
- Analysis: Examining the data to identify patterns, differences, and relationships.
- Interpretation: Understanding the results in the context of a particular question or objective.
- Presentation: Communicating the results through reports, tables, charts, or other formats.
For example, individual daily sales figures are data. Calculating monthly sales totals and comparing them with previous months produces information that can help an organization evaluate performance.
Information can then contribute to knowledge when it is combined with experience, understanding, and appropriate judgment.
Data Collection and Sources
Data collection involves gathering observations, measurements, records, or other values for a defined purpose.
The quality and suitability of the collected data influence the reliability of subsequent analysis.
Primary Data Collection
Primary data can be collected through several methods.
Surveys and Questionnaires
These methods gather responses from individuals or groups using structured or open-ended questions.
Interviews
Interviews collect information through direct conversations with respondents.
Observation
Observation involves recording events, behaviors, conditions, or activities as they occur.
Experiments and Measurements
Experiments and measurements generate data by testing conditions, measuring variables, or evaluating outcomes.
Secondary Data Collection
Secondary data can be obtained from sources such as:
- Government publications and statistical databases.
- Academic research and scientific publications.
- Organizational reports and historical records.
- Public datasets and research repositories.
- Previously collected surveys and studies.
Before using secondary data, it is important to evaluate its source, collection method, relevance, accuracy, and limitations.
Human-Generated Data
Human-generated data is created through human activities and interactions.
Examples include written documents, survey responses, customer feedback, photographs, messages, and manually recorded observations.
Machine-Generated Data
Machine-generated data is produced by devices, applications, automated processes, and other systems.
Examples include sensor readings, system logs, equipment measurements, automated transaction records, and application events.
Machine-generated data may be collected continuously or at predefined intervals, depending on the system and its configuration.
Observational and Experimental Data
Observational Data
Observational data is collected by observing events or conditions without deliberately changing the variables being studied.
For example, recording daily temperatures over a year produces observational data.
Experimental Data
Experimental data is collected through controlled tests or experiments in which one or more variables may be deliberately changed to examine their effects.
For example, testing different fertilizer treatments on plants can generate experimental data about plant growth.
The distinction is important because observational relationships do not necessarily demonstrate causation, whereas appropriately designed experiments can provide stronger evidence about cause-and-effect relationships.
Data Processing and Analysis
Data processing and analysis help transform collected data into useful results.
Data Processing
Data processing involves performing operations on data to prepare it for storage, use, or analysis.
Common activities include data entry, validation, sorting, filtering, aggregation, transformation, and error correction.
Data Organization
Data organization involves arranging data so that it can be accessed, understood, maintained, and used effectively.
Examples include organizing records into tables, grouping related files into folders, and categorizing survey responses.
Data Analysis
Data analysis involves examining data to answer questions, identify patterns, compare results, or evaluate relationships.
Common approaches include descriptive analysis, statistical analysis, trend analysis, and comparative analysis.
Data Interpretation
Data interpretation involves explaining what the results of an analysis mean in relation to the question, objective, or situation being examined.
Interpretation should consider the data’s limitations, the context in which it was collected, and the possibility of bias or alternative explanations.
Data Visualization
Data visualization presents data or analytical results through graphical representations.
Common examples include bar charts, line charts, pie charts, scatter plots, and maps.
Effective visualizations help communicate patterns and comparisons while reducing the effort required to understand complex results.
Data Quality and Integrity
Data quality and integrity influence whether data can be trusted and used appropriately.
Accuracy
Accuracy concerns whether recorded values correctly represent the facts, observations, or measurements they describe.
Completeness
Completeness concerns whether the required records and values are present.
Missing information can affect calculations, comparisons, and conclusions.
Consistency
Consistency concerns whether data follows compatible definitions, formats, and rules across records and sources.
Validity
Validity concerns whether data satisfies defined requirements, including acceptable formats, ranges, and logical constraints.
Timeliness
Timeliness concerns whether data is available at the appropriate time and sufficiently current for its intended purpose.
Data Integrity
Data integrity refers to the preservation of data’s accuracy, consistency, and reliability throughout its lifecycle.
Integrity can be supported through validation rules, access controls, change tracking, error detection, and appropriate storage and processing procedures.
Data quality and integrity are related but distinct. Quality describes how suitable data is for its intended use, while integrity focuses on maintaining data correctly and protecting it from inappropriate or unintended changes.
Data Lifecycle
The data lifecycle describes the stages through which data passes from its initial creation or collection to its eventual archival or disposal.
Data Creation and Collection
Data is generated, observed, measured, or collected from relevant sources.
The collection process should account for the intended purpose, required quality, and applicable legal or ethical requirements.
Data Storage and Organization
Collected data is stored in an appropriate location and organized for access, maintenance, and use.
Storage choices may include databases, file systems, document repositories, and other storage platforms.
Data Processing and Use
Data is validated, transformed, analyzed, or otherwise used to support activities and objectives.
Controls may be needed to preserve accuracy, integrity, confidentiality, and appropriate access.
Data Sharing and Distribution
Data may be shared with individuals, teams, organizations, or other authorized recipients.
Sharing should consider access permissions, confidentiality, privacy, contractual obligations, and applicable regulations.
Data Archiving and Disposal
Data that is no longer needed for routine use may be retained in an archive to satisfy historical, operational, legal, or regulatory requirements.
When data reaches the end of its retention period, it should be disposed of appropriately, taking into account applicable retention requirements and the sensitivity of the information.
The lifecycle may vary depending on the nature of the data, the purpose for which it is used, and the requirements governing its retention.
References
Online Sources
IBM – What Is Data?
Provides an overview of data, its characteristics, and its role in information processing and analysis.
Microsoft – What Is Data?
Explains the fundamentals of data and its role in data management and analytics.
Harvard University – Data Types
Provides educational guidance on data types and related concepts.
University of Delaware – Data Literacy Resources
Provides resources for understanding, interpreting, and working with data.
OpenStax – Data Types, Database Management Systems, and Tools for Managing Data
Explains data types, database management systems, and tools used to organize and manage data.